
Much of FDBs approach to Hydropower monitoring uses sensor input acquired at a high sampling rate. One such class of input includes rotational-phase-dependent information. Generator rotor poles fall into this category since the long-term performance development relates to each individual pole and not the average over all poles. FDB now offer rotor-phase-dependent analysis on the HydroCord platform. The solution is demonstrated using the IR based thermometer, RTM200, from MC-monitoring (MCm) as the source of sensor input.
MCm’s RTM200 senses the surface temperature of the rotor-pole by positioning the end-tip of an optical fiber just inside the air-gap between the stator and rotor of the generator. By sampling the temperature at about 2kHz a reading of the temperature profile over each rotorpole, at a given axial position, for each rotation of the unit is made.
HydroCord includes a software module that gives analysis plug-ins access to raw-data streams from all sensors and a solution for communicating analysis results into the data flow. A general class analysis plug-ins combine sensor input with a fixed angular position in the rotating system. Combining the two allows the determination of specifics of dynamics as a function of the absolute angular position of the rotating system, and therefore useful for many stationary sensing devices, such as the RTM-200 from MCm.
Data from the RTM-200 captured at Øygreyfoss was used in in playback mode at FDBs Data-lab, simulating high speed data samples into the analysis plugins, and for developing and testing a version rotational-phase-dependent analysis plug-in but customized for the RTM-200. The flexibility of the analysis-plugin concept allows more detailed analysis and can be applied on many other types of sensing devices.
For more info about the measurements at Øygreyfoss and the RTM-200, please look at our Whitepaper:
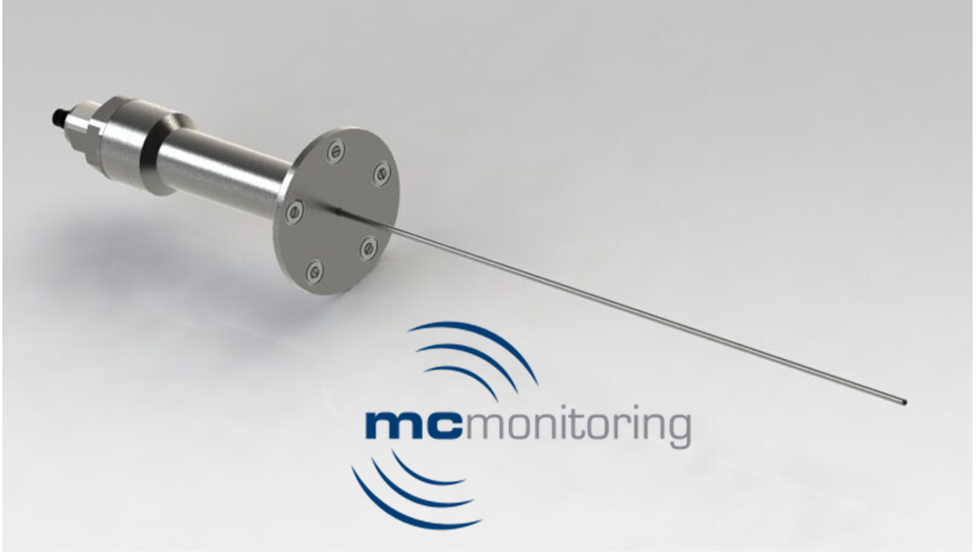
Img 1: IR based thermometer, RTM 200, from MC monitoring (MCm)

Img 2: Maximum pole temperature - Average over 1s or 5 rotations